

A Multi-Year Customer Experience Transformation

TL;DR
Over a three‑year partnership,
my team and I undertook a radical transformation of Norfolk Southern’s AccessNS customer portal. The results? A 30% drop in helpdesk tickets, an 84% reduction in error‑prone sessions, and a total savings of 388 user‑days of customer effort in just one quarter.
Background
Norfolk Southern is one of the five largest railroads in the United States. Its reach is vast and its operations genuinely complex at scale.
In 2020, they were deep into building AccessNS — their third-generation customer portal. Built atop systems dating back to the 1960s, AccessNS was designed as a unified self-service interface for planning, scheduling, managing, and paying for freight shipments nationwide. Yet engagement lagged, and many customers bypassed it entirely in favor of direct calls to NS service agents.
My team was brought on to understand why, build a roadmap for change, and design solutions that would finally deliver on what AccessNS had promised. Three years of some of the most challenging and rewarding work of my career followed.
The Challenge
Legacy Infrastructure
Core systems traced back to the 1960s. Every solution would need to work around constraints that couldn't be engineered away — creativity over brute force.
Siloed Stakeholders
Multiple product owners focused on isolated functional areas with no shared end-to-end customer view. Getting them aligned would require deliberate facilitation, not just good design.
Data Blind Spots
We started with no robust analytics to reveal where users struggled — only call-center logs. Our first job was building the instrumentation to see the problem clearly.
Misaligned Features and Design
The UI prioritized data display over task completion and carried a dated visual aesthetic. We weren’t going to blow up AccessNS, but we did need to phase in a ground-up rethink.
My Role
Recruited, onboarded, and upskilled talent rapidly to build a team capable of performing at enterprise scale
Planned and led two large-scale customer journey mapping workshops and follow-on analysis activities
Partnered with our research manager to translate Quantum Metric data into actionable design recommendations
Maintained direct relationships across Norfolk Southern's operations, customer support, IT, product management, and marketing teams
Led the Macquarium UX team across a three-year engagement with Norfolk Southern
Co-led product roadmapping, program planning, and workstream management with our VP of Delivery and Norfolk Southern decision makers
Owned estimates, SOWs, timelines, and resourcing across the full engagement
Managed six UX designers directly — cross-training, peer reviews, performance management, and day-to-day project enablement
Our Approach
1. Discovery & Team Structure
An engagement of this scale needed the right structure from day one. I worked in tandem with our VP of Delivery and in direct partnership with NS's lead SME and product owners. The core team comprised six senior UX designers, three project managers, and a research manager, plus embedded NS SMEs, product owners, and IT specialists throughout.
We moved quickly into discovery — intensive stakeholder sessions feeding into workflows, Confluence documentation, and mind-mapping tools. The goal was a strong baseline understanding of how AccessNS worked, what was planned for its rolling releases, and what customers were telling support teams about using it. We needed to know the system before we could fix it.

2. Customer Journey Mapping
Discovery confirmed what we suspected: NS's customer support was deeply siloed. Each line of business — Unit Train, Intermodal, Industrial Products, and others — had its own processes, needs, and operational teams with little shared visibility across them. We wanted to break down those walls.
Starting with the two largest segments, we gathered the key players and ran two large-scale workshops to deconstruct the full customer journey — planning, booking, managing, and paying for shipments, along with everything that could go wrong along the way. The insights were significant. So were the opportunities.

3. Product Roadmapping
With discovery and journey mapping complete, we had what we needed to build a credible roadmap. I worked with NS SMEs and our VP of Delivery to inventory key use cases and features, analyzing each against customer value, business value, level of effort, and likely constraints and risk. Cross-referenced against other NS initiatives, the picture became clear.
We socialized the results with NS leadership, validated priorities, and turned the output into a program schedule that could keep us running ahead of NS IT's development backlog. The roadmap gave everyone a shared north star while the day-to-day work lived in JIRA.
4. Co-Creation and Design Community
Six UX designers were each chosen specifically to own an independent workstream. Each paired with an NS product owner to co-create concepts and deliberately stress-test them — throwing metaphorical wrenches at every design to find what would break before it could break in production.
Daily scrums included dedicated peer review time. Twice-weekly sessions brought the full team together to workshop ideas in Figma and Miro. Research and project management crossed into design work wherever it added value. The result was a team that learned continuously, maintained consistency across workstreams, and caught feature overlap before it became a problem. Structured, egalitarian, and genuinely collaborative — it’s a fabulous way to work.
5. Governance & Handoff
Completed designs passed through a central governance council; representatives from NS operations, customer service, IT, product management, marketing, and leadership all had a seat at the table. It was a rigorous process, but the right one for an engagement of this complexity. Progress was reported to NS leadership quarterly, keeping decision-makers informed and the roadmap accountable.
Once approved, designers and product owners moved into active handoff support. Features not yet scheduled for development were documented thoroughly enough to be picked up cleanly whenever their place in the backlog arrived. We didn’t want to leave anything in a state that would require rediscovery.
6. Close the Loop
This wasn't a one-shot engagement. Each release was instrumented with Quantum Metric and evaluated against call center analytics and customer feedback surveys. What we learned fed directly into the next cycle — watch, understand, improve, repeat. Over three years that loop ran continuously.
By the end, we were proud not only of our own work but of the NS team as well. They had internalized the methodology and the user focus. The roadmap was still full, but they had a fully-formed framework in place for continuous, iterative improvement.
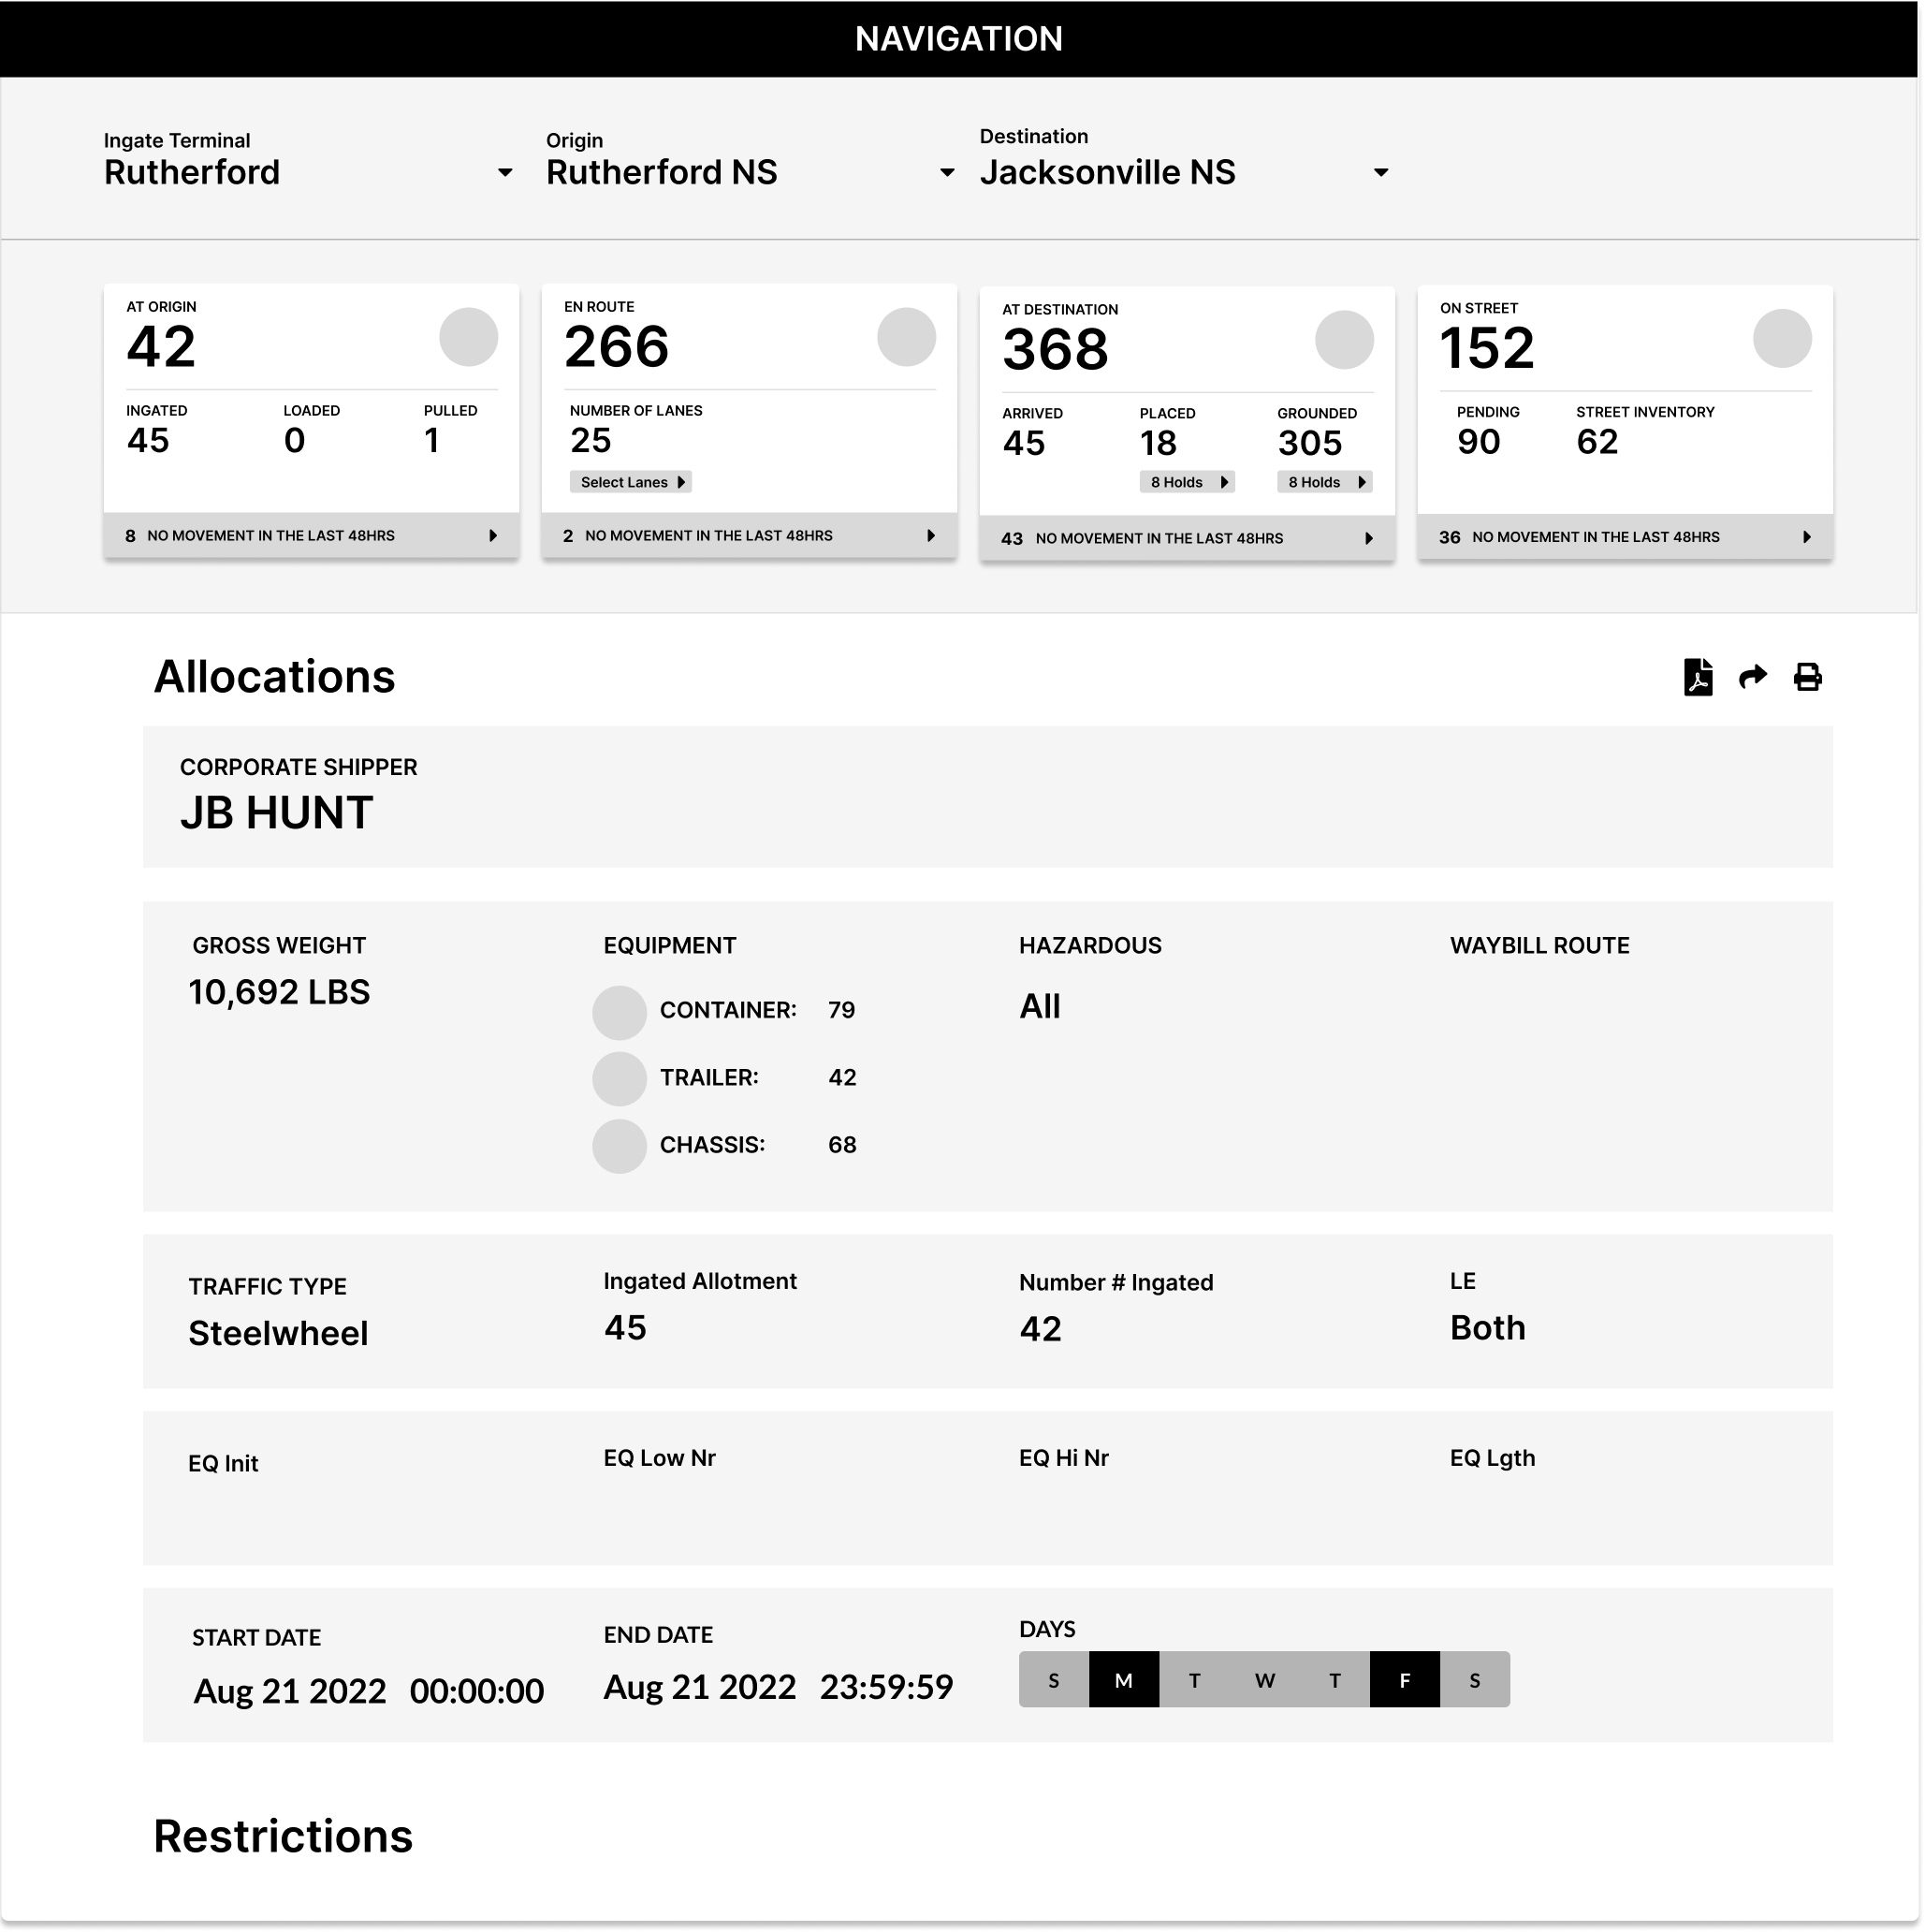
The Solution
(Or at least a small part of it…)
A refined dashboard with real-time data and flexible self-service paths

Live tracking tracking of shipments

Assisted diagnosis & resolution of shipping issues

Predictive ETAs for easier route planning

Interactive help tools via Pendo integration

The Results
in customer service help desk volume
30% reduction
A combination of more robust, self-explanatory features and in-depth guidance dramatically drove down customers’ need for technical assistance.
of users’ time saved in just one quarter
388 days
With AccessNS originally focused on data display, customers had to find manual workarounds for routine tasks. We brought them a huge set of intuitive, time-saving self-service capabilities.
in unique sessions with errors
84% decrease
Customers had been continually frustrated with bugs, slow page load performance, and inefficient design elements. Our work radically improved speed, stability, and reliability.